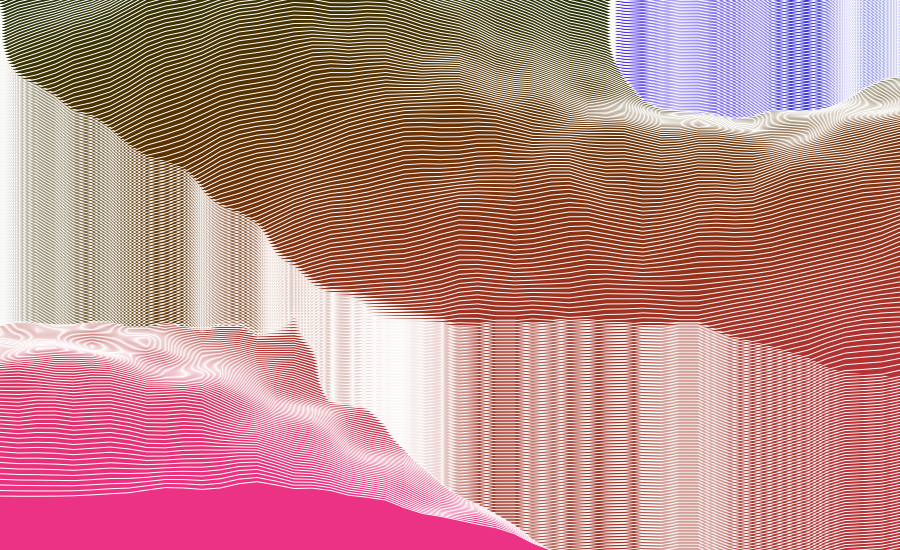
Created by Satoshi HORII at Rhizomatiks, (centiscript) is a JavaScript based creative code environment for creating experimental graphics. Imagined as an endless exploration from one script to another, Satoshi sees (centiscript) as a tool for visual thinking. Each experiment can be shared online since it relies on JavasScript + HTML + Canvas.
More than any time in the history of the Web, incumbents in the network economy are consolidating their power and staking new claims to key points of control. Welcome to the first iteration of the Web 2.0 Summit's theme, Points of Control!
an HTML DOM Visualizer Applet
Personas shows you how the Internet sees you. An installation by Aaron Zinman.
Artist and computer scientist Jonathan Harris makes online art that captures the world's expression -- and gives us a glimpse of the soul of the Internet.
Below are 50 of the best data visualizations and tools for creating your own visualizations out there, covering everything from Digg activity to network connectivity to what s currently happening on Twitter.
Reveals the privacy vulnerabilities of web different web browsers.
ANOPTIQUE developpe et accompagne la mise en contexte cooperative de logiciels libres favorisant les pratiques de l' Intelligence Collective, en particulier dans le domaine de la visualisation d'information.
The InfoVis:Wiki project is intended to provide a community platform and forum integrating recent developments and news on all areas and aspects of Information Visualization.
form follows data - data visualization & visual communication
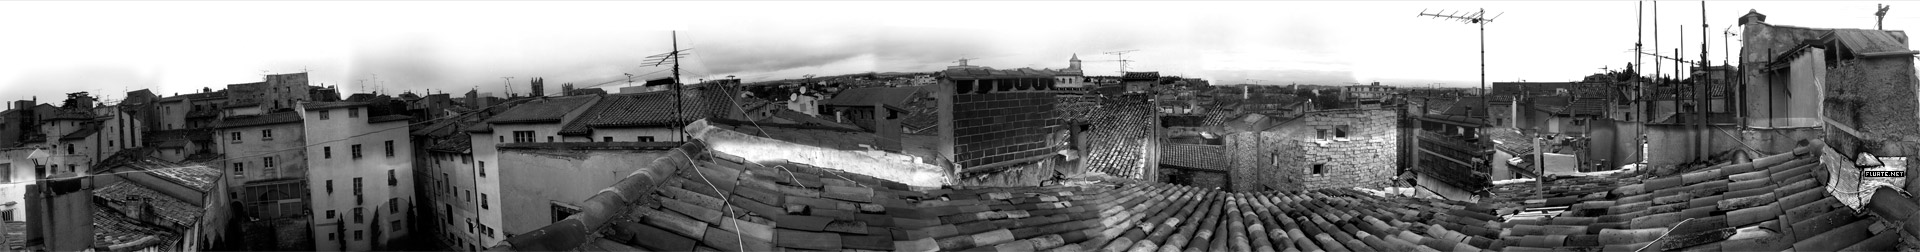
WebTracer is an project based on the intention to visualise the structure of the web. There are many applications that analyse websites for structural integrity and diagnostic purposes, but few reveal the visual structure that web hypertext creates.
The language for intuitive relationships between humans and machines
Cabspotting traces San Francisco's taxi cabs as they travel throughout the Bay Area. The patterns traced by each cab create a living and always-changing map of city life. This map hints at economic, social, and cultural trends that are otherwise invisibl
Today s growing collections of data hide a wealth of relationships between people, organizations and ideas. Our powerful visualization solutions let you discover and explore these relationships simply and intuitively.
unreal visualisation is used for real world interference. the telezone project combines physical world behaviour with internet coordination and visualisation. going beyond this means to create an xperience, where visual information transfer was. what else
Digital harmony of the motion graphics of him
Building navigation interfaces
Works of marcos weskamp
Blog agregator talking about processing
They rule allows you to create maps of companies
Flash browser for the links
Tracking the way we use language
Search engine and discovery engine