A painstaking investigation of Europe’s cave art has revealed 32 shapes and lines that crop up again and again and could be the world’s oldest code.


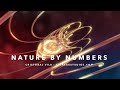
The movie Nature by Numbers created by Etérea [etereaestudios.com] is a beautifully illustrated animation focusing on remarkable geometrical and mathematical properties.
http://www.etereaestudios.com/docs_html/nbyn_htm/about_index.htm
ANOPTIQUE developpe et accompagne la mise en contexte cooperative de logiciels libres favorisant les pratiques de l' Intelligence Collective, en particulier dans le domaine de la visualisation d'information.
experiments in VJ software, data visualization, technique and tools
Toolkit for building interactive information
Building navigation interfaces
Works of marcos weskamp
Relation between text, space and time
Blog agregator talking about processing
Experiments and explorations of algorithms
A portait of romantic breakup by golan levin
Digital art that makes use real-time data source