An interactive map of the evolutionary relationships between 1.8 million species of life on our planet. Each leaf on the tree represents a species and the branches show how they are connected through evolution. Discover your favourites, see which species are under threat, and wonder at over 100,000 images on a single page.

Carbon dioxide (CO2) is an important heat-trapping (greenhouse) gas, which is released through human activities such as deforestation and burning fossil fuels, as well as natural processes such as respiration and volcanic eruptions. The chart on the left shows the CO2 levels in the Earth's atmosphere during the last three glacial cycles, as reconstructed from ice cores. The chart on the right shows CO2 levels in recent years, corrected for average seasonal cycles.

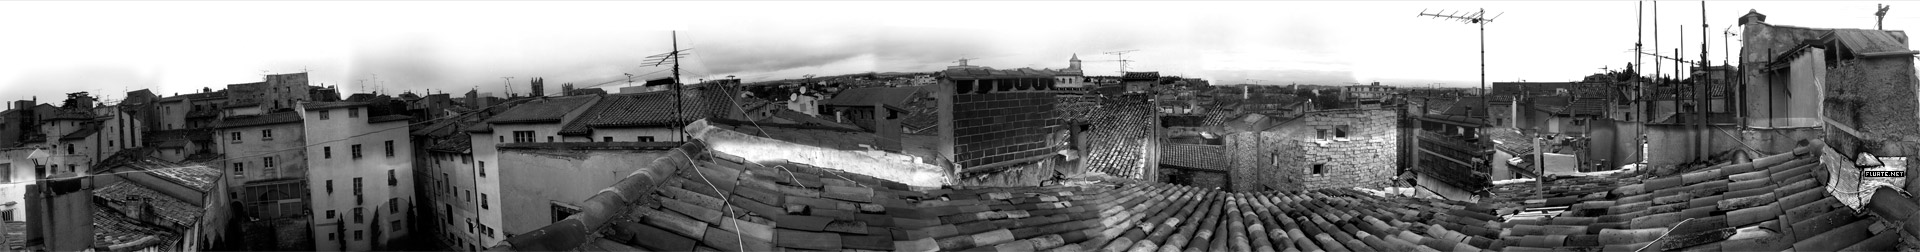
This piece of work is a bird's eye view of the history by scaling down a month length of time into one second. No letter is used for equal messaging to all viewers without language barrier. The blinking light, sound and the numbers on the world map show
The movie Nature by Numbers created by Etérea [etereaestudios.com] is a beautifully illustrated animation focusing on remarkable geometrical and mathematical properties.
http://www.etereaestudios.com/docs_html/nbyn_htm/about_index.htm
Data Visualization is a transversal discipline which harnesses the immense power of visual communication in order to explain, in an understandable manner, the relationships of meaning, cause and dependency which can be found among the great abstract masse