
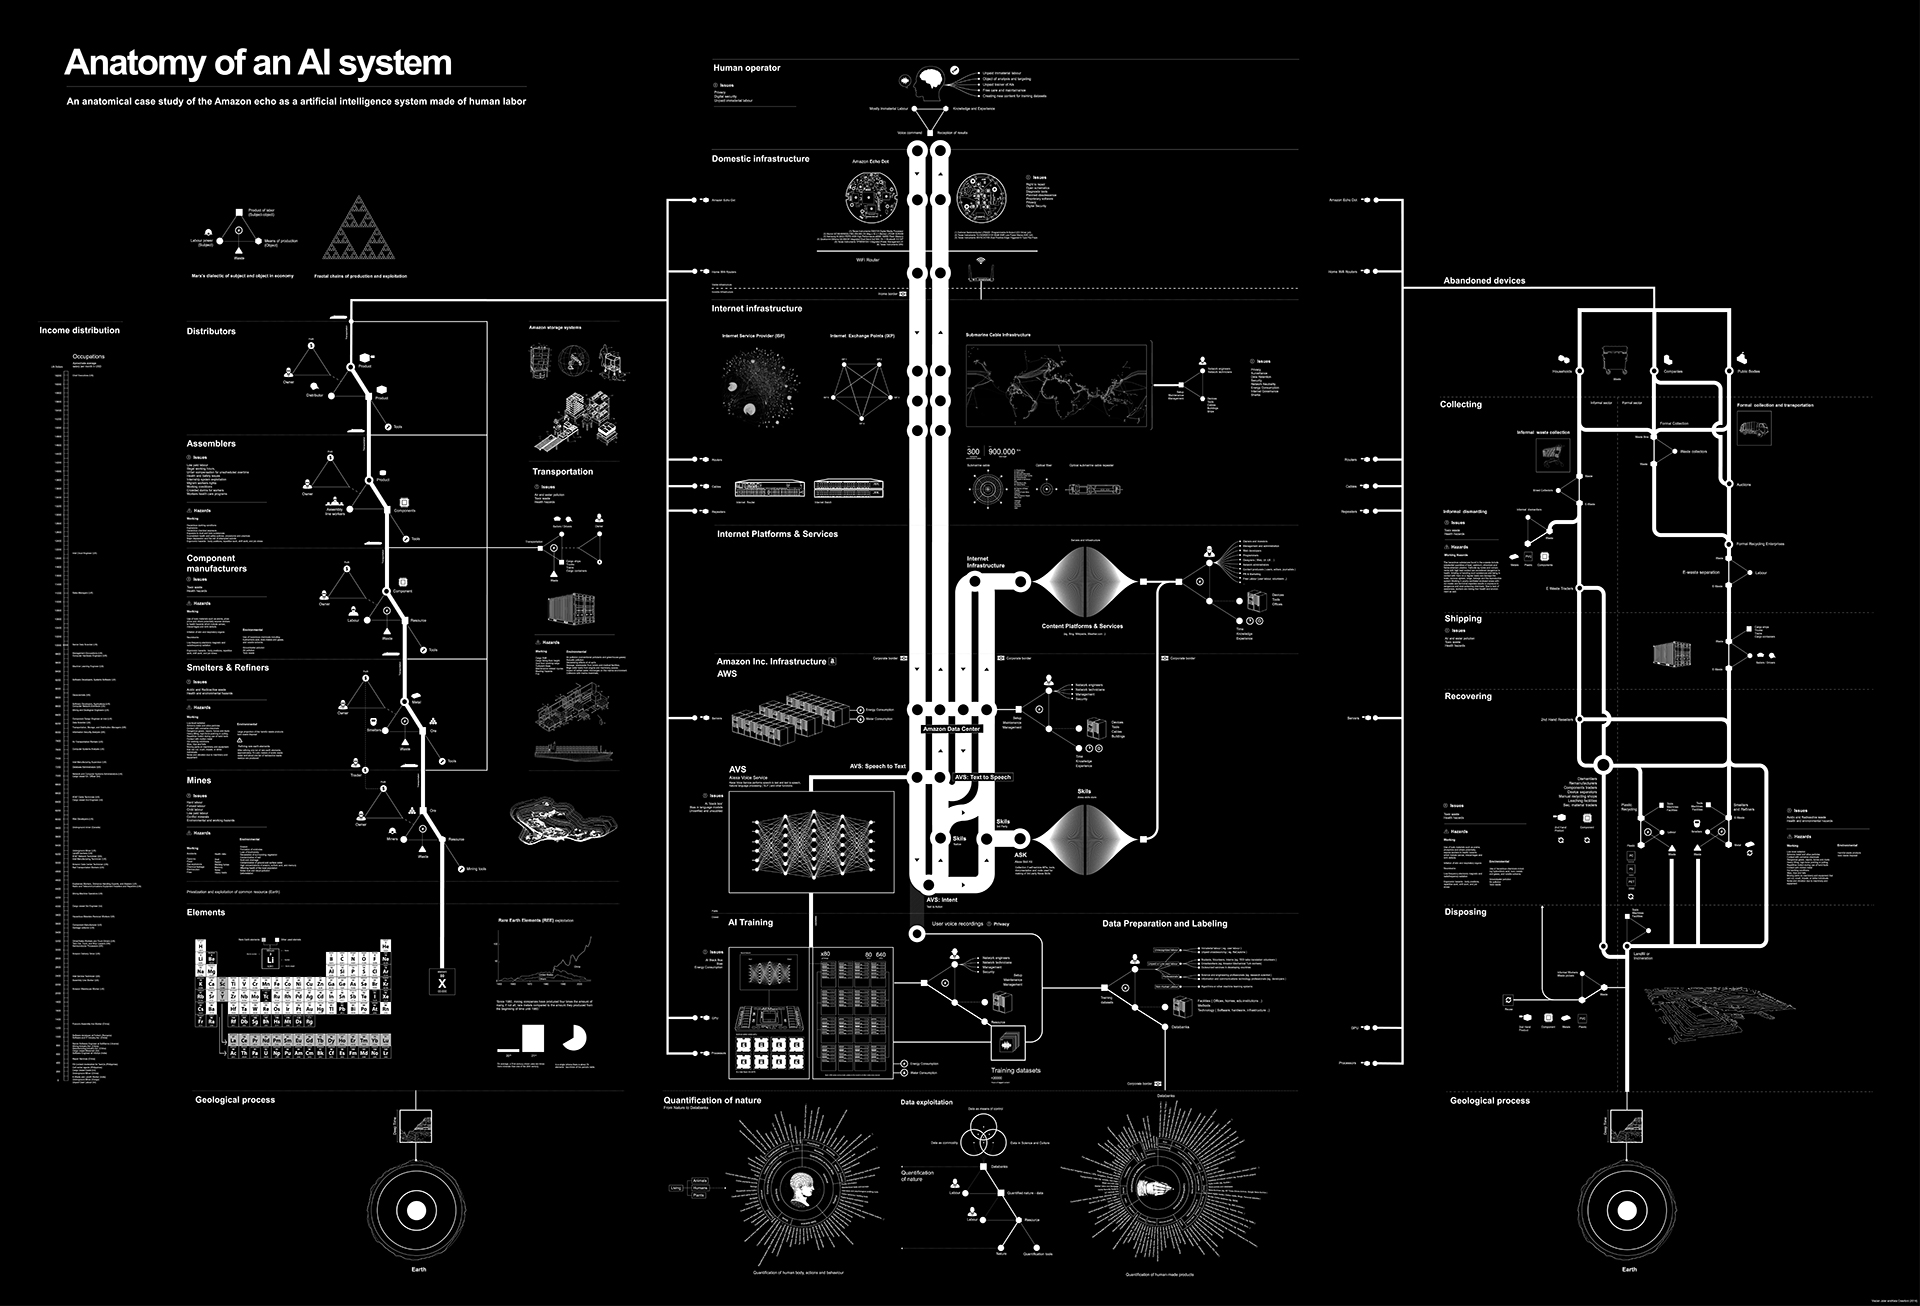
An anatomical case study of the Amazon echo as a artificial intelligence system made of human labor
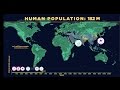
It took 200,000 years for our human population to reach 1 billion—and only 200 years to reach 7 billion. But growth has begun slowing, as women have fewer babies on average. When will our global population peak? And how can we minimize our impact on Earth’s resources, even as we approach 11 billion?
Visualization of the market place, by size and colors
Almost 216 million people, or 3.15% of the world population, live outside their countries.
A massive central data source and a handy way to graphically compare nations.
When you enter phrases into the Google Books Ngram Viewer, it displays a graph showing how those phrases have occurred in a corpus of books.
David McCandless turns complex data sets (like worldwide military spending, media buzz, Facebook status updates) into beautiful, simple diagrams that tease out unseen patterns and connections.
All the blogs with cool data visualization eye candy
Personas shows you how the Internet sees you. An installation by Aaron Zinman.
Below are 50 of the best data visualizations and tools for creating your own visualizations out there, covering everything from Digg activity to network connectivity to what s currently happening on Twitter.
ANOPTIQUE developpe et accompagne la mise en contexte cooperative de logiciels libres favorisant les pratiques de l' Intelligence Collective, en particulier dans le domaine de la visualisation d'information.
unreal visualisation is used for real world interference. the telezone project combines physical world behaviour with internet coordination and visualisation. going beyond this means to create an xperience, where visual information transfer was. what else